Detection of
Phytoplankton Groups in European Waters using Satellite images
Mati Kahru, mkahru@ucsd.edu
“Standard” ocean color
images (e.g. O’Reilly et al., 1998) of chlorophyll-a are
indispensable in providing spatial distributions of phytoplankton biomass in
Case 1 waters (by definition Case 1 waters are those where the optical
properties are dominated by phytoplankton and its associated products). Most
coastal waters, e.g. in European shelf seas, are not Case 1 waters and the
standard ocean color algorithms have large errors due to problems in
atmospheric correction and interference by suspended sediments and colored
dissolved organic matter (CDOM). It may seem contradictory but blooms of
specific phytoplankton groups also produce anomalous optical properties that
deviate from Case 1 waters. It has been demonstrated that these anomalous
optical properties can be used to distinguish between blooms of different
phytoplankton groups or even species. The following analysis used software
from Wimsoft (http://wimsoft.com). The time series
of satellite data with information on phytoplankton groups can provide
unprecedented information on the space-time dynamics of the marine ecosystem.
Currently the following phytoplankton taxa can be distinguished from satellite data:
·
Nodularia spumigena (and other cyanobacteria accumulations in the
·
Cyanobacteria Trichodesmium spp.
in the global ocean (Subramaniam et al., 2002)
·
Coccolithophores
(Brown et al., 1994)
·
Dinoflagellates
with Mycosporine-like amino acids (
·
Diatom blooms
(Sathyendranath et al., 2004)
· Detection of other phytoplankton groups in specific conditions is quite possible but needs further development.
·
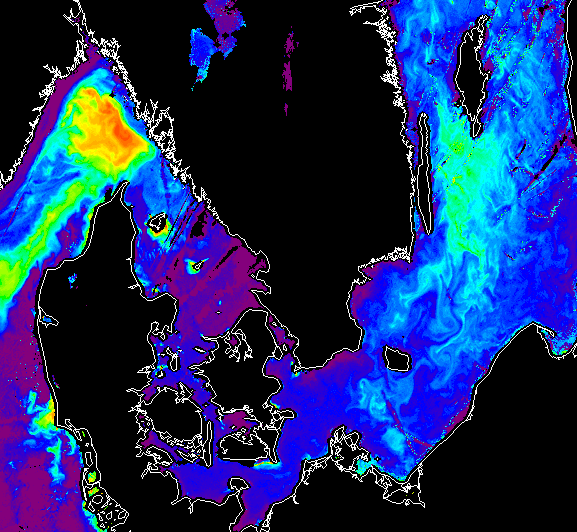
The example above
is a SeaWiFS image of nLw555 (normalized water-leaving radiance at 555 nm) on
July 9, 1999. It shows increased reflectance due to at least two separate
blooms: a coccolithophore bloom in the Skagerrak and the Nodularia bloom in the
·
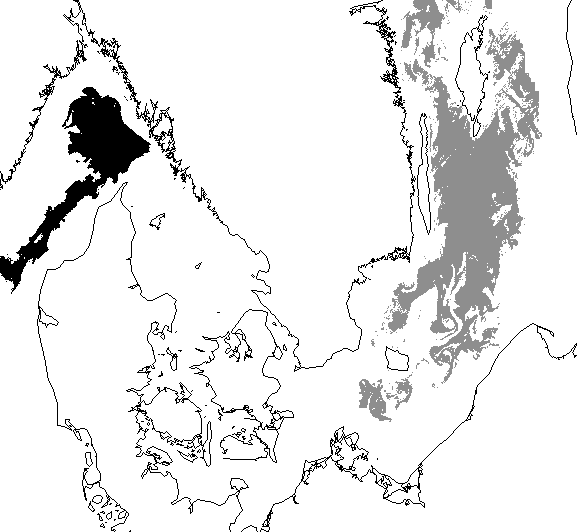
Classification
result of the previous image: coccolithophore bloom shown in black and the Nodularia bloom in dark gray.
While classification of
phytoplankton blooms at 1 km resolution looks great compared to the resolution
obtained from a typical oceanographic cruise, it has a number of limitations.
In general case it is probably impossible to invert of the remote sensing
reflectance spectrum and derive the concentrations of phytoplankton groups. The
detection of phytoplankton groups is only possible under certain conditions:
·
The bloom has a
relatively high biomass and occurs near the surface.
·
The bloom
involves certain conspicuous phytoplankton species or groups with specific
optical characteristics (e.g. Nodularia,
coccolithophores, Trichodesmium, large
diatoms with strong pigment packaging, etc).
·
Knowledge of
the local phytoplankton is crucial: certain species or groups are known to
bloom in certain areas and this helps their detection.
·
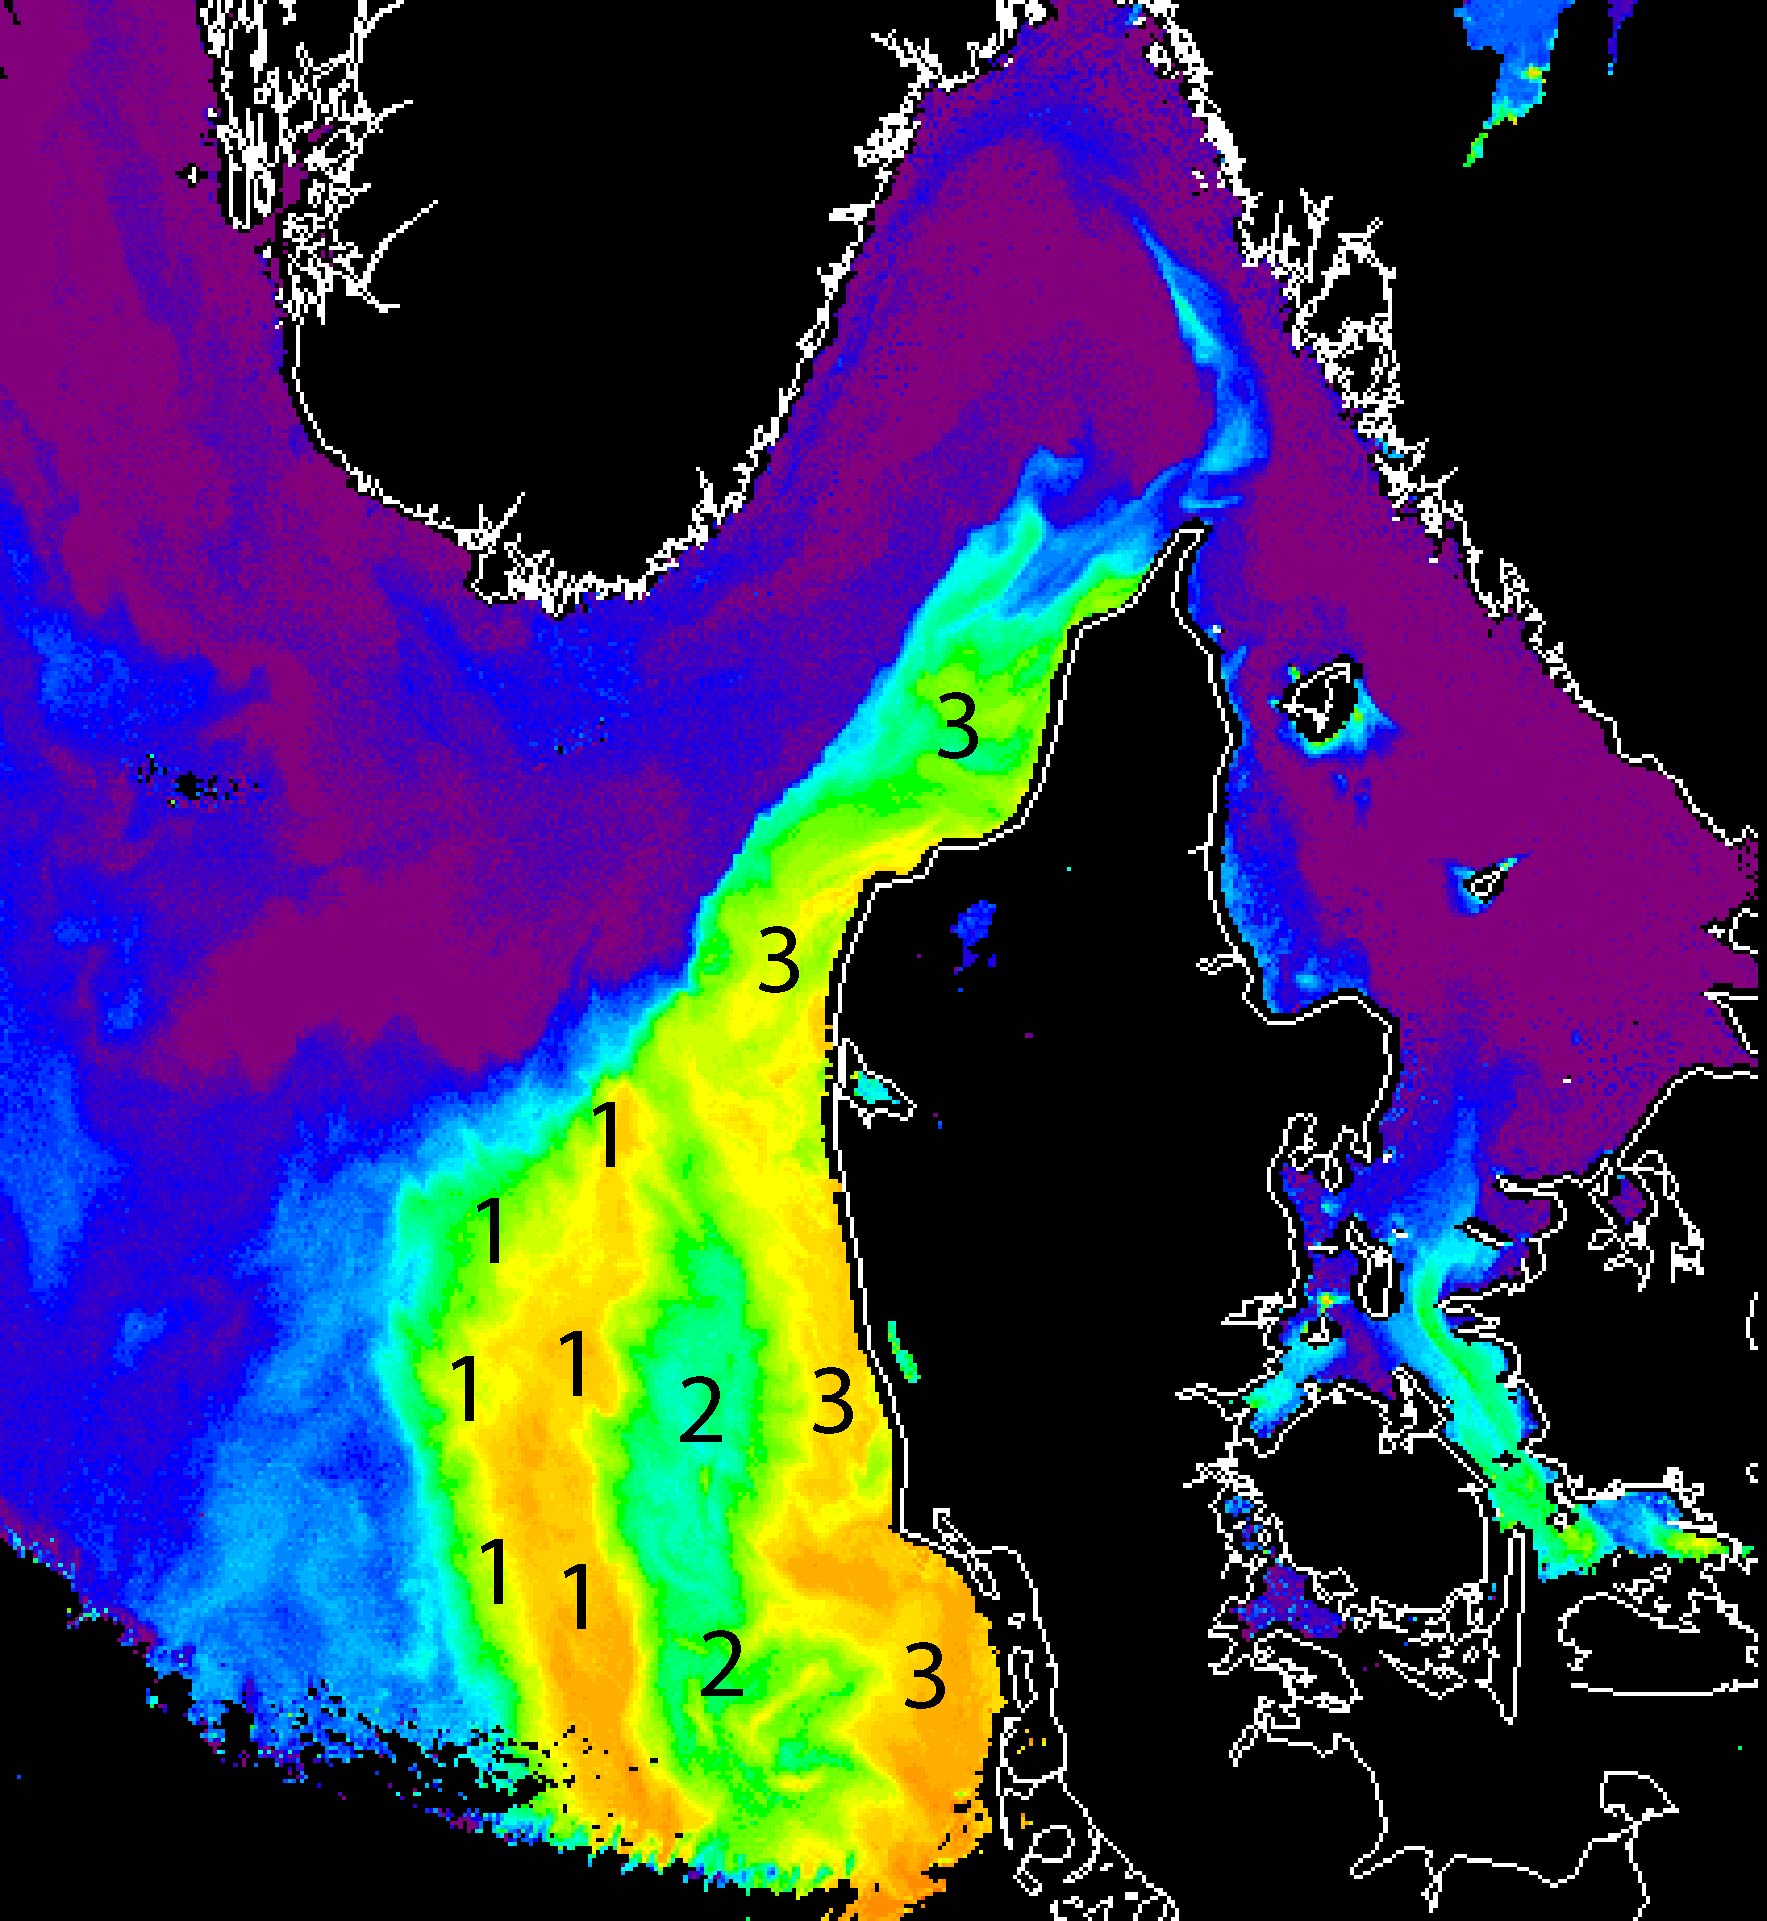
The example
above (SeaWiFS nLw555) from March 15, 2002 shows the spring bloom consisting of
different phytoplankton assemblages. Knowledge of the local phytoplankton is
essential for classifying this image. A very tentative classification without
knowledge of the local conditions might be three assemblages with the
associated with the dominant group: (1) coccolithophores, (2) diatoms, (3) eukaryotic
picoplankton. The distribution of the assemblages is shown by their respective
number on the image.
The study of
phytoplankton optical characteristics is an area of active research and new
results are expected. It is certain that much more studies are needed in this
very promising field. Currently there is only one satellite-derived time series
of a phytoplankton group that is more than a decade long and consistent over
the whole period – the time series of the cyanobacteria (Nodularia spumigena) blooms in the
References
Brown, C.W. and J.A. Yoder. Coccolithophorid blooms
in the global ocean. J. Geophys. Res., 99, 7467-7482.
Kahru, M., U. Horstmann, O. Rud, Satellite detection
of increased cyanobacteria blooms in the
Kahru, M. Using satellites to monitor large-scale environmental change: A case study of cyanobacteria blooms in the
Kahru, M., B.G. Mitchell. Spectral reflectance and absorption of a massive red tide off
Kahru, M., J.-M. Leppänen, O.Rud, O.P.
Savchuk. Cyanobacteria blooms in the Gulf of Finland triggered by saltwater
inflow into the
O'Reilly, J.E., S. Maritorena, B.G. Mitchell, D.A.
Siegel, K.L. Carder, S.A. Garver, M. Kahru and C.R.
McClain. Ocean color chlorophyll
algorithms for SeaWiFS. J. Geophys. Res. Vol. 103, No.C11, p.
24,937-24,953, 1998.
Sathyendranath, S., L. Watts, E.Devred, T. Platt, C. Caverhill,
and H. Maass. Disrcimination of diatoms from other phytoplankton using ocean color data.
Mar. Ecol. Prog. Ser., 272, 59-68,
2004.
Subramaniam, A., C.W. Brown, R.R.
Hood, E.J. Carpenter, and D.G. Capone. Detecting Trichodesmium
blooms in SeaWiFS imagery, Deep-Sea Res. II, 49, 107-121, 2002,